
Edmonton Industrial Property Market Report, August 2023
Overview
It’s been a turbulent ride for industrial use property over the last three years as oil & gas plunged to record lows through the pandemic response and then reaching record highs at the onset of the Ukraine war. Distribution also became a major priority during the pandemic as it necessitated consumer delivery services and warehousing of supply. This has resulted in significant demand for industrial use space in both warehouse/distribution and oil & gas related property types.
Market Trends
New developments in market preferences and user necessity have advanced the industrial sector to a new era of demand and product requirements. Propelling this new era of industrial warehousing includes e-commerce, automation technology, sustainable designs, logistical improvement, and flexible space.
The growth of e-commerce has led to an increase in demand for warehousing & distribution property, as the need for last-mile delivery facilities that can quickly get products to customers has expanded at a rapid pace.
Automation & AI technology are transforming the industrial real estate sector as much as they are other industries. Smart warehouses and distribution centers are becoming increasingly necessary to compete and provide good service. Features such as robotics, artificial intelligence, and the Internet of Things (IoT) improve efficiency and reduce costs.
Many industrial real estate owners and tenants have started prioritizing sustainability in their operations. This includes incorporating energy-efficient features, such as solar panels and LED lighting, and implementing environmentally friendly practices, such as waste reduction and water conservation.
The COVID-19 circumstances have highlighted the importance of logistics and supply chain management. Industrial real estate properties that are well-located and well-equipped to support efficient and reliable supply chains are in high demand.
Industrial real estate users are increasingly seeking flexible spaces that can accommodate changing needs in an uncertain world. This includes spaces that can be easily reconfigured or expanded, and properties that offer a range of amenities and services, such as shared conference rooms and co-working spaces.
Insights
Alberta's industrial real estate market has historically been strong due in part to the province's natural resources, such as oil, gas, forestry, & rare minerals. Alberta’s topography also allows for excellent roadways, providing access to these natural resources, as well as transportation of goods across the province.
Tenant demand for industrial properties has remained robust, which has put upward pressure on rental rates. This has been driven by a range of factors, including a booming natural resource sector, growth of e-commerce, and the need for efficient supply chain & logistics operations. With a vast, relatively flat landscape, Alberta is well suited for industrial warehousing and manufacturing facilities. It affords lower acquisition prices and rental rates, making it an attractive destination for industrial real estate investors and developers looking to acquire or develop high-quality properties.
Energy scarcity perpetuated by the Russia-Ukraine war, has increased oil & gas prices to a profitable level for Alberta. Political & economic relations with Russia are expected to remain strained into the foreseeable future, which opens opportunity for Alberta to provide energy to Europe and Global markets that have boycotted Russian resource exports. However, to what extent our resources will be available will largely depend on the regulatory and political barriers preventing Alberta’s resources from getting to market.
Market Conditions
Although the Government of Canada has repeatedly said that the economy is strong, this statement is misleading the public. Canada’s economy has largely stagnated, as economic growth has declined dramatically in recent years, and a trend that is likely continue into the foreseeable future. Excessive population growth through immigration, increases in federal spending, and money printing have created a pseudo increase in GDP. In actuality, growth in real incomes and living standards has stalled. Between 2016 & 2019 and through the last year, in almost every measure of economic growth the Canadian Government has failed to gain ground. GDP per person was stagnant and continues to stagnant post pandemic. Business investment from 2014 to 2021 declined 20% and is only equal to 55% of US levels. Much of this investment decrease is due to the decline in the oil & gas industry within Alberta, which has been largely responsible for new innovation and investment projects in the country. Investment into Alberta has returned with more favourable oil & gas prices, but the investment has not returned to the same extent, as there are significant political, regulatory, and logistical uncertainties that are hindering investment into the province.
Alberta’s economy, however, continues to perform well relatively to the rest of the country and the western world. Various economic indicators are as follows:
The West Texas Intermediate (WTI) price of oil, often a world reference price quoted in the media, appears to be holding around $70 - $80/bbl USD. Oil production in Alberta was 19.01 million cubic metres in March 2023, up 3.3% from the year prior, indicating steady production in the province. Since then, the Suncor facility has shut down for maintenance decreasing production, however this will only be temporary.
In June 2023, Alberta's seasonally adjusted unemployment rate was 5.7%, a minor increase of 0.5% from last year, down 0.3% from January. Alberta had $340B in GDP in 2022, which is the second largest increase in GDP within Canada at 5%. Non-residential capital investment in Alberta increased by 14% in 2022 to $63B.
In the first quarter of 2022, net migration into Alberta was 51,718, compared to 16,821 in the same quarter of 2022, which had similar figures as 2015 to 2019, an increase of 252.5%. Nationally, net migration was 340,666 in the third quarter of 2022 compared to 175,633 in the same quarter of 2021. Net international migration into Alberta was 35,932 a 200% increase, while net interprovincial migration was 15,786 a 225.5% increase from the year before.
In Alberta, urban housing starts totalled 2,368 in June 2023, a year-over-year decrease of 29.2%.
There were $4.1B worth of homes sold in Alberta through the Multiple Listing Service (MLS), up 6.3% from June 2022. Alberta recorded $1.9B in building construction investment, a decrease of 19.6% from May 2022. In May 2023, Alberta municipalities issued $1.3B in building permits, a decrease of 13.8% from May 2022.
On a year-over-year basis, Albertans paid 1.9% more in for the goods and services that comprise the Consumer Price Index (CPI) than in the same month a year ago, Alberta’s CPI appears to be back to stabilized levels.
After reducing the overnight interest rate to 0.25% in 2020, the Bank of Canada has since raised the overnight rate to 5% effective on July 12, 2023. As the economy ramps up again, the effects of an increased money supply from government handouts and global supply-chain issues have taken centre stage as inflation hit a thirty-year high of 8%. Since then, reported CPI is down to 2.8%, which is on par with projections. It is unclear whether the BoC will raise the rate further.
Forecast
Alberta is in a good position to weather the coming recession if it can resist federal overreach regulations and can get its products to the markets that desperately need them, such as Europe. Oil prices are expected to remain above $70/bbl USD for some time as the globe reorients its energy supply-chains, which bodes well for the Alberta’s energy sector and royalty revenue. However, a lack of investment due to political and regulatory uncertainty has limited the economic potential of the province and its industries. Positive economic indicators such as a strong job market and population growth has also contributed to increased need for industrial properties, which are expected to continue. Rising interest rates have led to higher borrowing costs but have not appeared to significantly slow growth in the market.
Price Trends
Industrial price increases have been seen across the region, and demand for the property type appears to be unwavering. However, new product continues to be constructed and absorbed, which has kept prices from escalating by considerable margins, maintaining a healthy market equilibrium.
Transactions
YEAR AMOUNT NO.
2020 $325,388,652 145
2021 $699,599,472 189
2022 $792,561,236 232
2023 $374,814,605 82
The above chart indicates that industrial sale volumes in Edmonton have been steadily increasing since 2020, with 2023 likely on par with 2022 figures.
Vacancy
CBRE is reporting that vacancy rates dropped 20 basis points in Q2 of 2023 from the previous quarter to 2.8% the lowest it’s been since 2015. This taken into context with 1.4M sq.ft. of new supply entering the market this quarter, indicates a strong demand for industrial use space.
Nisku/Leduc display the highest vacancy at 3.8%. Although this represents a below average vacancy, this market is still catching up from overdevelopment prior to 2015 and the subsequent fallout from the oil price collapse.
Acheson is showing the lowest vacancy at 0.4%. It’s low tax expense and diversification of product has allowed it to maintain a relatively low vacancy over the last two decades.
Absorption
According the CBRE, the industrial market saw 1.3M sq.ft. of positive absorption through the second quarter of this year with over 800,000 sq.ft. pre-leased new supply, indicating that participants are eager to move into new, suitable space.
Despite having higher vacancies, the Nisku/Leduc market area experienced 962,000 sq.ft. of positive absorption, demonstrating the increase in activity in the area.
Cap Rates
Industrial capitalization rates have remained relatively stable throughout the last few years in spite of unsettled interest rates and uncertain economic conditions. The increased need for warehousing and low interest-rates maintained demand for the property type through 2022, stabilizing cap rates. Into 2023, the increase in oil & gas prices led to a flourishing of occupant activity, increasing prices and putting downward pressure on caps. Simultaneously, the excessive increase in interest rates have dampened prices and put upward pressure on cap rates. Risk in the sector is relatively low due the continued prospects of warehousing necessity and high energy prices, which has brought greater attention from investors looking for stable returns and a place to park their money as an inflation hedge.
Edmonton proper: 6.5% - 7%
Greater Area: 7% - 7.5%
Lease Rates
Lease rates have seen a significant spread between high-quality new product and older lower quality product.
The following is a rental rate survey for various areas located on the “Edmonton Real Estate Zone Map.”
*These lease rates are an accurate representation of the general area but may not be accurate to a specific property within the area.
*Lease ranges are largely dependent upon the age, condition and amenities displayed on the property.
*Lease rates are on a price per square foot & triple net basis.
Edmonton Real Estate Zone Map
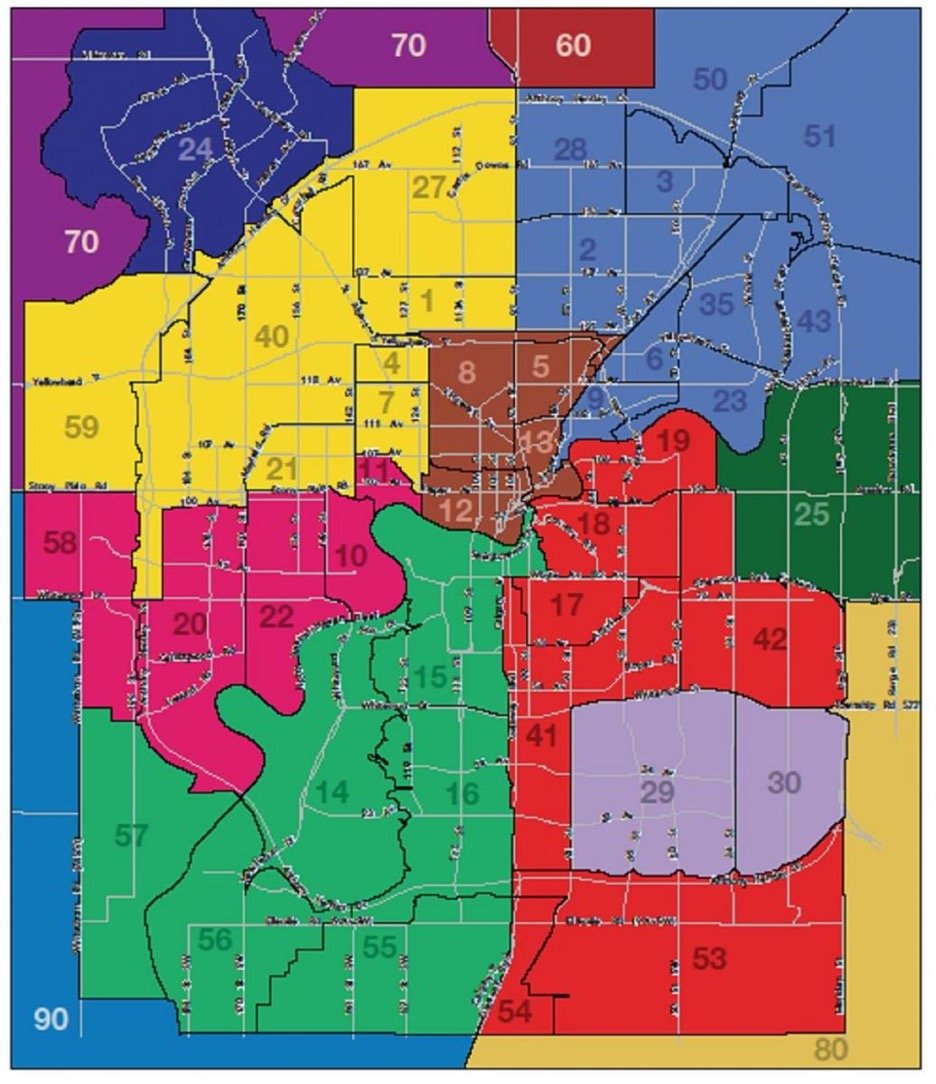
NORTH CENTRAL
Zone 5, 8
$7.50 - $12
CALGARY TRAIL
$10
EAST CENTRAL
Zone 17, 18, 19
$10 - $11
WEST
Zone 20, 21, 22
$12
NORTHWEST
Zone 1, 27, 40
$8 - $12
NORTHEAST
Zone 23, 28, 35, 43, 50, 51
$13.50
PARSON & CALGARY TRAIL COMMERCIAL AREA
Zone 41
$9 - $15
SUMMERSIDE/ELLERSLIE
ZONE 53, 54
$15
ST. ALBERT
$11 - $14
SHERWOOD PARK
$13 - $16
SPRUCE GROVE
$12 - $15
LEDUC / NISKU
$7 - $12